


By Joseph D’Aleo
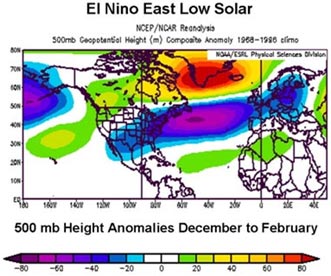
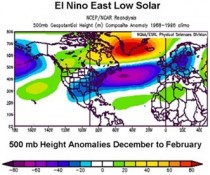
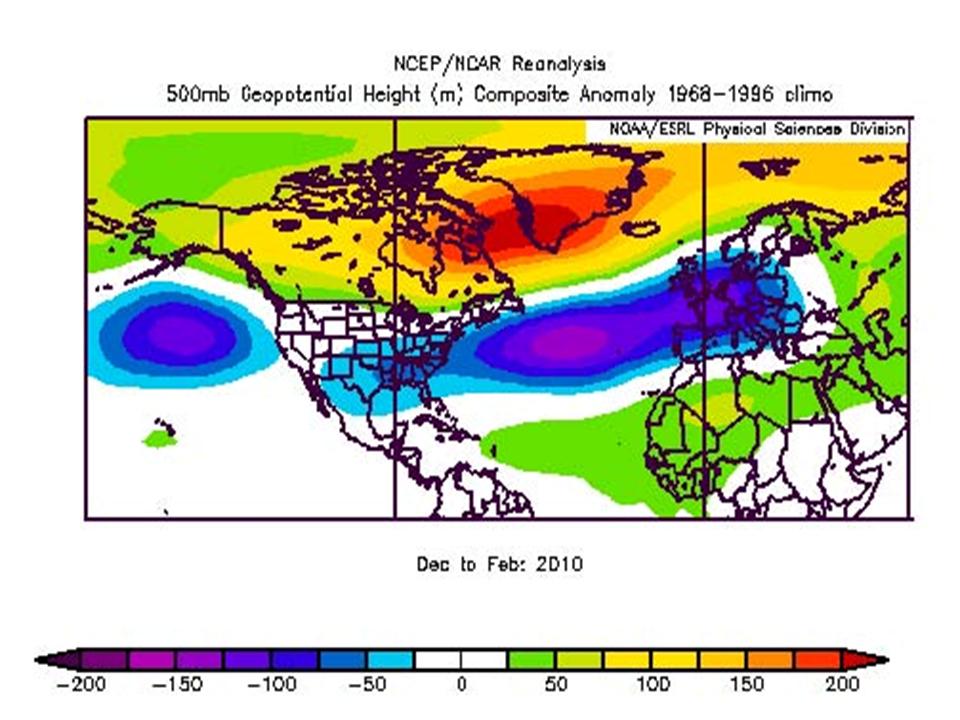
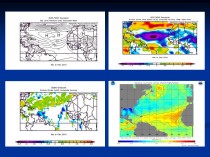
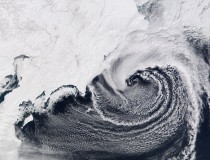
The pop in global temperatures, even the satellite lower troposphere, the last few months seems surprising to some in the Northern Hemisphere where the winter was hard. In Russia, it may have been the coldest on record, while across northern China, Europe and the southern and central United States, it was the coldest since the late 1970s or even the early 1960s. It was not unexpected. In the late fall, we showed the following upper level anomaly pattern was likely for the winter given the low solar, El Nino and developing east Quasi-Biennial Oscillation or QBO (shown in research by our own Climate Prediction Center to modulate solar and El Nino Southern Oscillation or ENSO) (enlarged here).
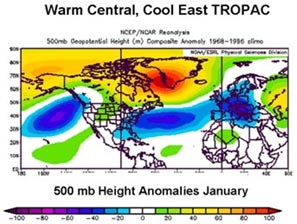
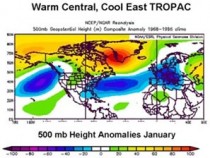
Also the warmest water in the Pacific was biased towards the central Pacific most of the winter. This pattern given the name Modoki, produces this very similar pattern in winter (enlarged here).
See how well the actual winter 500mb anomalies correlated to the two patterns (enlarged here).
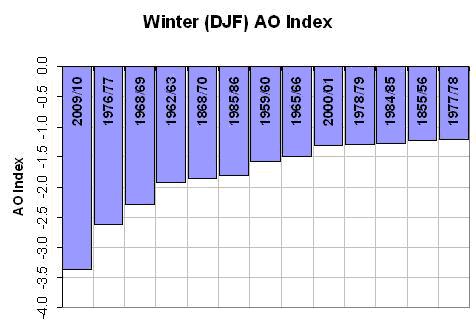
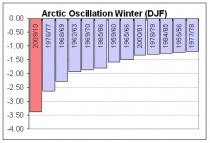
Both had a very strong high latitude blocking signal (above normal heights in polar regions). This high latitude blocking is reflected in the negative arctic oscillation state, a record since 1950 (enlarged here).

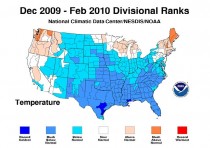
The effect on the surface has been a cold winter as discussed in the US and across Eurasia (enlarged here) and here .
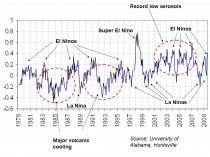
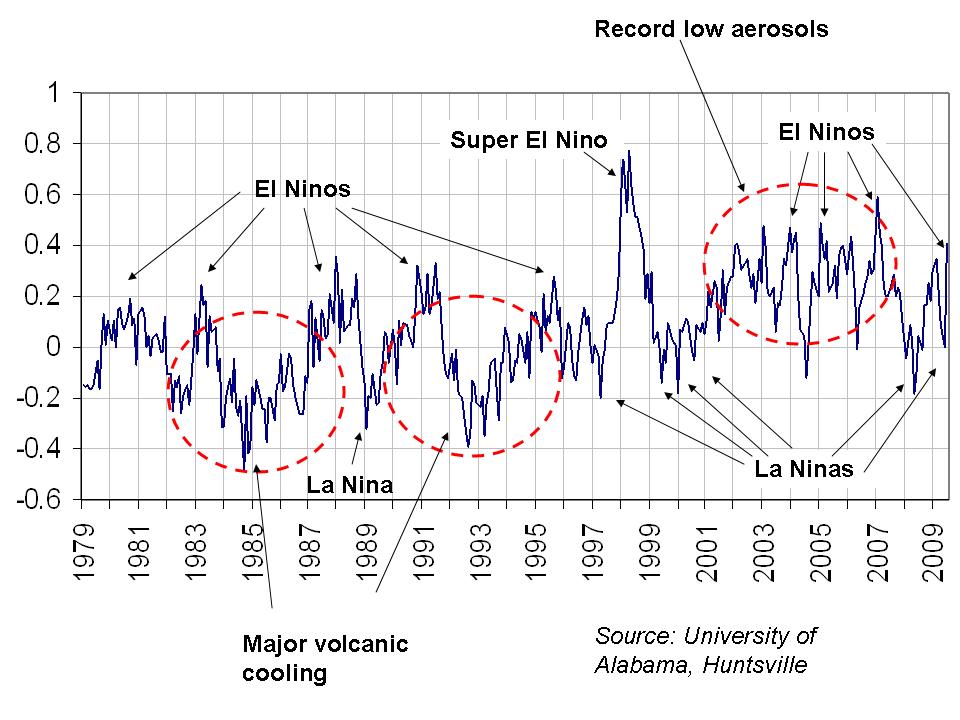
So why the satellite temperature blip upwards? First of all the temperatures always spike up in El Ninos and down in La Ninas (enlarged here).
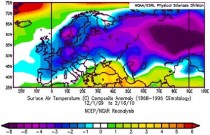
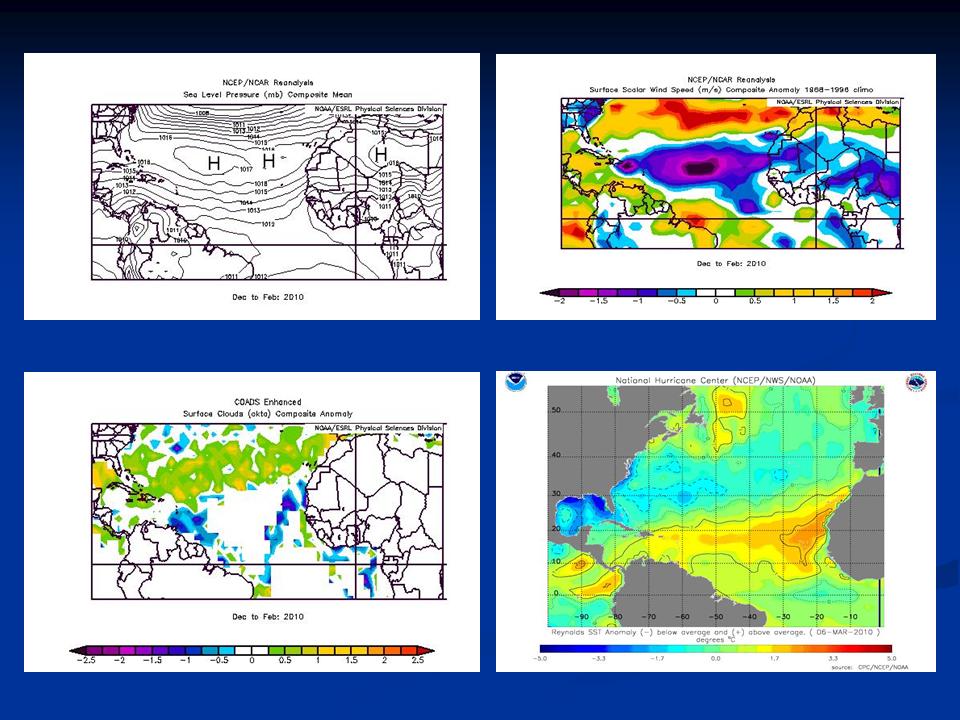
This is because El Ninos translate into warm tropics and subtropics. When the AO is strongly negative the subtropical jet stream is depressed south and the subtropical high pushed south and weakens. This results in weakened trade winds and easterlies. The high pressure causes increased subsidence which results in less cloudiness. Both of these factors lead to warmer water in both the tropics and subtropics. Since these latitude bands have the largest areas (the earth’s circumference is greatest at the equator), they contribute to the global blip. You can see the suppressed subtropical high, winds, cloudiness and elevated temperatures here (enlarged here).
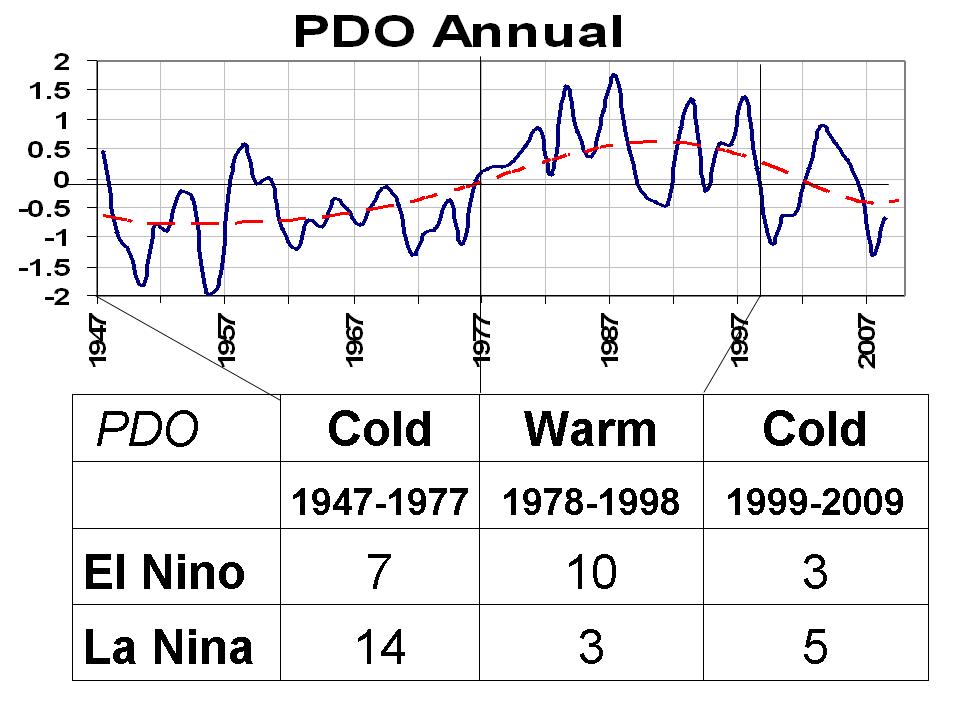
THE PDO POPS BUT WILL DECLINE
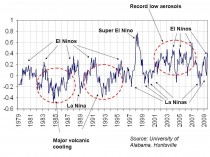
The PDO also popped slightly positive. It usually tracks with El Nino and La Nina. Here we see how it tracks with one El Nino measure, the Multivariate ENSO Index (MEI) of NOAA CDC’s Klaus Wolter (enlarged here).
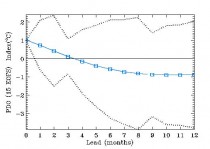
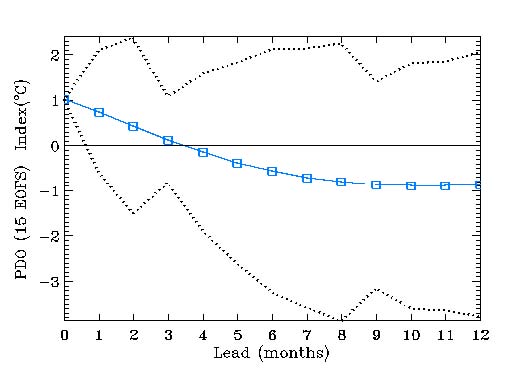
But if indeed we are in the cold PDO multidecadal mode, it should quickly decline as La Nina return quickly. NOAA’s Climate Diagnostic Center’s PDO forecast agrees (enlarged here).
The PDO exhibits a 60 year multidecadal cycle. Notice La Ninas are more frequent, stronger and longer lasting in the cold modes and El Ninos briefer. The opposite is true for the warm mode. In both case, the ratio is 2 or 3 to 1 (enlarged here).
Since the El Ninos lead to warming and La Ninas cooling, this factor alone can explain the 60 year cycle in temperatures we have observed. The slight blip up reflects urbanization, land use changes / increasingly bad siting (enlarged here).
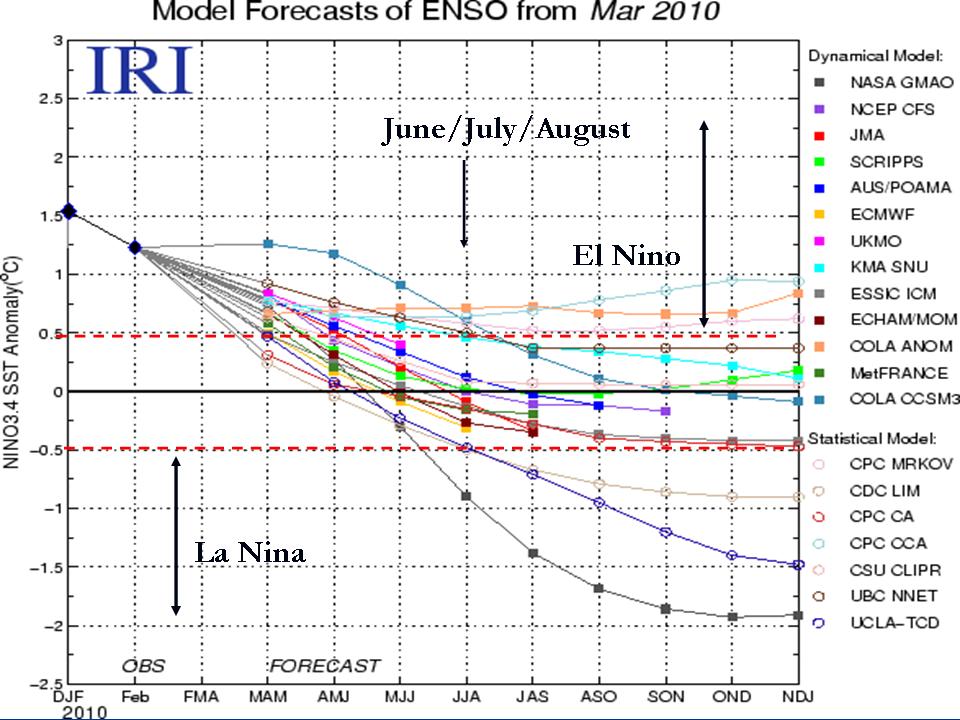
As discussed in a recent link, most ENSO models see a quick demise to this El Nino. Some have La Nina returning as early as this summer. This may mean a hot late summer for the central US but a return to cold across Alaska, Canada and the northern US this next winter (enlarged here).
So with a cooler La Nina and return to the negative PDO, temperatures should dip again much as they did in 2007 when we started the year with El Nino and ended with a strong La Nina. See much more here.
Adjusted Temperature Record for PennsylvaniaBy Jennifer M. Cohen, PhD.
ABSTRACT
This report compares the raw with the United States Historical Climatology Network Version 2 (USHCN V2) adjusted temperature records for the twenty-four USHCN listed temperature stations in the state of Pennsylvania. Averaging over the twenty-four stations the raw data yielded a small linear decline with temperatures trending -0.1 plus or minus 0.1 C/century, while the U.S. Historical Climatology Network (USCHN) Version 2 adjusted data revealed an increase of 0.7 plus or minus 0.1 C/century. Over the twelve year period 1998-2009 a drop in temperature was observed in both data sets with a raw trend of -0.75 ± 0.1 C/decade and an adjusted trend of -0.65 plus or minus 0.1C/decade.
INTRODUCTION
The USHCN Version 2 (USHCN V2) temperature record adjustment scheme is designed to “reduce uncertainty in temperature trends for the United States”. Raw data are subjected to checks for inconsistencies, such as a daily maximum that is lower than the minimum and errors or a temperature reading that is impossibly high or low. “Time of observation” corrections are introduced which can change the overall temperature trend over time when compared to the raw record. Menne, et al estimate that this yields an increase in the maximum temperature trend of 0.15C per century and an increase in the minimum trend of 0.22C per century. Hence, we anticipate an average increase of about 0.185C per century to be added to whatever trend is found in the average temperature raw data. This is consistent with the USCHN Version 1 (USHCN V1) adjustment method.
An adjustment for updating from liquid in glass (LiG) to the current electronic thermometers results in a further rise in the temperature trend. Temperature stations were updated beginning in the early 1980s. Most were equipped with the electronic versions in the mid-80s, but 10% of the stations were updated after 1994. Approximately 0.52C is added to the raw maximum reading while 0.37C is subtracted from the minimum to account for the electronic readings. Therefore, recent average temperatures are increased by about 0.075C to account for the new equipment which is about 0.025C higher than USHCN V1. We will consider temperature records from 1895 through 2009 and compute temperature trends over a century. This adjustment is expected to add something in the neighborhood of 0.075C per century to whatever trend is seen in the raw data.
Menne, et al combine documented and undocumented changes made after the TOB adjustments in giving their changes to the temperature trends. Their estimate of raising the maximum temperature trend by 0.31C per century, while leaving the minimum temperature trend unchanged, includes the LiG to electronic switchover. These combined changes serve to elevate the average temperature trend by about 0.155C per century. Thus, roughly 0.08C per century is added to the trend due to factors other than switching from LiG to electronic measurement.
Summarizing, we anticipate an upward shift in the average temperature trend of about 0.34C per century. This includes the TOB adjustment increase of 0.185C per century, an increase of 0.075C per century during the LiG to electronic measurement switchover, and a 0.08C per century increase for other documented and undocumented changes.
An important feature of this update involves dropping the Version 1 correction for the Urban Heat Island (UHI) effect in favor of an algorithm that detects undocumented change points. This technique should spot sudden shifts such as undocumented station location and equipment changes. It is less clear how it detects the much slower change in the size of a population center.
The checks and adjustments leave the casual observer to wonder how the raw temperature trends compare with those of the final USHCN V2 product where they live. This survey addresses that question for the state of Pennsylvania.
CALCULATIONS
The temperature records are those available through the online USHCN database. Their locations within Pennsylvania are shown in Fig. 1. Nine of the twenty-four stations had records that ended prior to February of 2010. Data were converted from Fahrenheit to Celsius for this review. No changes were made in the data.
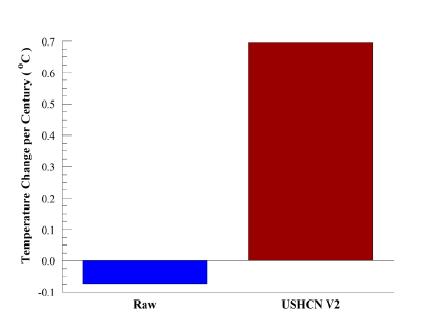
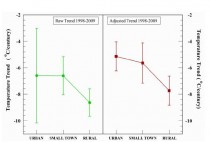
Linear least squares was employed to find the best straight line fit through the data. Our interest is not in the precise average temperature for a given year, but in the temperature trend or slope of the line. Averages of the trends were taken over the twenty-four stations. The raw and USHCN V2 adjusted temperature trends are depicted in Figure. The raw temperature records show a decrease with temperatures trending at a rate of -0.1 plus or minus 0.1 C/century and the USHCN V2 records reveal an increase of 0.7 plus or minus 0.1 C/century (below, enlarged here).

Adjustments have resulted in an increase of about 0.8 C/century. This was higher than the 0.34C per century we had initially anticipated. Since the introduction of the electronic temperature stations likely took place prior to 1995, a second round of data analysis was initiated. This should eliminate or nearly eliminate the LiG to electronic thermometer correction in the temperature trend.
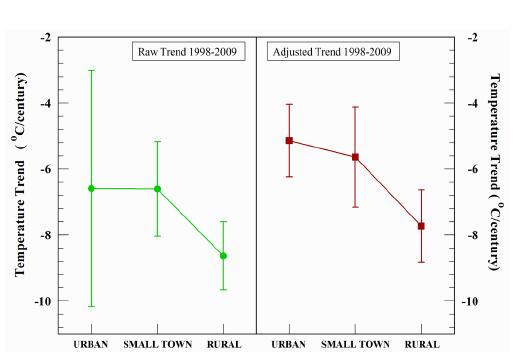
Consider the records for the years from 1998 to 2009, a period during which there may have been a temperature drop. Linear regression was used to determine the best fit linear trend. The sampling error makes it impossible to detect the LiG to electronic thermometer 0.075C uniform shift. However, in this case the temperature trend itself is of interest. During the 1998-2009 time period, a trend toward cooler temperatures was observed for stations in rural, small town, and urban locations (below, enlarged here).
CONCLUSIONS
In the state of Pennsylvania the raw temperature record reveals no significant change in temperature over the period from 1895 to 2009. The USHCN V2 adjusted temperature record shows an increase of less than a degree Celsius over those years. A cooling trend is observed in the raw and USHCN V2 records for the past 12 years. In both the short and longer term cases the USHCN V2 adjusted data yielded trends that were roughly 1C per century higher than those found in the raw temperature records. See full post with individual station plots.
By VJones, Digging in the Clay
Congressman Johnson may be concerned about the increasing population on Guam causing the island to tip over, but has population increase had interesting consequences for one of the island’s weather stations?

Andersen Airforce Base, Guam (original here)
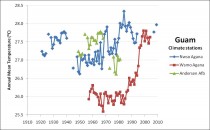
There are three stations for Guam in the GHCN data file: Andersen AFB; NWSO Agana and WSMO Agana. For such a small island three weather stations, all in similar topography on the northern part of the island, would be expected to show very good correlation, after all they are within 10 miles of each other, but one shows a very large and sudden warming during the 1990s.
These are the stations from GISS Station Data:
NWSO Agana, G 13.5N 144.8E (WMO id 91212) Rural area 1921 - 2010
WSMO Agana, G 13.6N 144.8E (WMO id 91217) Rural area 1956 - 2004
Andersen AFB, 13.6N 144.9E (WMO id 91218) Rural area 1949 - 1981

As these are all classified as rural stations, they are not adjusted. NWSO Agana is located at the busy international airport, seen in the picture above just inland from the capital, Hagatna, at night. Andersen Airforce Base is in the northeast of the island, but WSMO Agana was hard to find initially due to the very approximate latitudes and longitudes in the GISS station data.
Here is what the three temperature records look like when plotted together (below, enlarged here):
For Andersen AFB and NWSO Agana there are variations of just over a degree, and there is obviously a discrepancy between them in how the local topography responds to climate. Also, these are airports so there may be human influences there. However, that is one hell of a rise in WSMO Agana. How can you get that much warming at one of three such close stations in such a short period? Did no-one notice? I thought a lot of the checking that is done of the climate record is supposed to pick up and throw out “outliers”? OK, perhaps that is just the odd month or the odd year. This has intrigued me for a while. That cannot be normal and it certainly isn’t caused by CO2. Time to do some digging…
VJones looks at the 3 stations in some detail in the post. She continues:
NCDC site - the end date for WSMO Agana: 2nd April 1998. NCDC concurs. Quick - scroll back up to that graph again. Yup - data for WSMO Agana up to 2004. How can this be? FILLED in DATA?
Now the WWRC also had data for these three stations, although it said “last updated 2006”. There was a good fit with what I had pulled off the GISS site (at the end of November) - the data originating in the NCDC GHCN data file. I just plotted what I found and there are minor discrepancies granted, but it is the gaps I was interested in (image here).
In the Western Region Climate Center (WRCC) data, Andersen AFB continues reporting until 2002, with rising temperatures; WMSO Agana stops reporting in 1997 (as it should); there is no gap for NWSO Agana, but that fits reasonably closely with the post-1997 WMSO Agana data. So in the GHCN/GISS data NWSO Agana stops reporting for a while, but the data seems to be spliced into another station. Interesting. So what? Well the implications only become clear when you realise what this does to the temperature anomalies. The following graph (enlarged here) shows the effect:
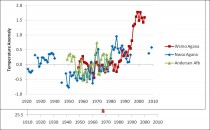
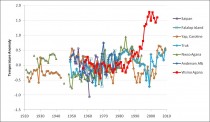
Look at that hockey stick - wow! This gives a sustained 1.5 degree anomaly for Guam for nearly a decade. See in the post here how it affects numerous grid boxes used to compute global anomalies. See here also how it stands out as an outlier with respect to other stations in the region. Note that Koror (Palau) and Truk (Chuuk) are over a 1000km from Guam. WSMO Agana still sticks up like a sore thumb.
By Lissette Gonzalez, CBS4
Unless you spent this winter somewhere else, you know it was chilly, at least by South Florida standards. Now, with the data in, the National Weather Service has made it official. The first 3 months of the year were the coldest ever reported in Miami Beach, Naples, and West Palm Beach, and was among the coldest winters ever for Ft. Lauderdale and Miami.
That information was included in an analysis of winter weather patterns conducted by the National Weather Service weather forecast office in Miami.
Forecasters said March set record cold readings for Miami Beach, which was 5.8 degrees colder than normal, on average, and for Naples, where the average temperature was almost a degree colder than the previous record.
Forecasters say, overall, there were only a handful of days where temperatures were above normal in South Florida.
Miami temperatures averaged almost 5 degrees below normal, making the January-March period the 9th coldest ever, while Ft. Lauderdale had it’s 4th coldest period ever.
While the cold weather of winter appears to be over, that doesn’t mean South Florida won’t continue to see cooler-than-normal temperatures, according to the National Weather Service.
Their outlook claims cooler than normal coastal water temperatures in Florida will combine with the continued “El Nino” weather pattern to likely keep April temperatures below the norm.
The May forecast sees temperatures closer to normal, but that comes with the likelihood rainfall will be greater than normal. All of South Florida also saw an increase in rainfall when compared to previous years, but West Palm Beach, with almost 11 inches of rainfall in March, saw it’s 5th wettest march ever. Miami Beach, with just over 4 inches of rain in March, saw it’s 9th wettest March ever. See story here.
---------------------
Longest Below 80F Streak in many Southern Locations
NWS
High temperature of 80 degrees today ends record-breaking streak of below 80 days at 105 at the Jacksonville international airport. It still remains the coldest start to a calendar year in Jacksonville climate history. Today, the maximum temperature at Jacksonville International Airport reached 80 degrees. The last time the temperature reached 80 degrees was on December 15th, 2009. This streak is ranked first for the longest stretch of days without reaching 80 degrees since records began at the airport in 1948.
In addition...across southeast Georgia...Saint Simons Island and Alma have both set new records for consecutive days below 80 degrees. In fact it has been 5 months since either site has reached 80 degrees...last year on October 31st, 2009. Including today...the 151 consecutive day streak below 80 degrees breaks the old record of 146 days set at Alma in the winter of 1969-70...and ties the old record of 151 days at Saint Simons Island set in the winter of 1968-69.
Record of consecutive days of daily high temperatures below 80 degrees has ended in Shreveport, Louisiana on Wednesday, March 31st. As part of the very cold late fall and winter experienced across the four state region, high temperatures have failed to reach 80 degrees in Shreveport, LA since last doing so on October 15th, 2009, where the high temperature reached 84 degrees. This resulted in a record 166 consecutive day streak being set Tuesday, March 30th, 2010, surpassing the old record of 165 days ending on March 27th, 1924. Nearby Texarkana, AR (records since 1892) has a record of 174 days below 80F, through 3/31/2010 (new record: began 10/9/2009 still ongoing.) El Dorado set a record of 172 days beating out the 166 days in 1987.
By Henk Tennekes
Engineers cave in to green pressure, thanks to politically driven funding.
Wind energy is an engineer’s nightmare. To begin with, the energy density of flowing air is miserably low. Therefore, you need a massive contraption to catch one megawatt at best, and a thousand of these to equal a single gas- or coal-fired power plant.

If you design them for a wind speed of 34 miles per hour, they are useless at wind speeds below 22 mph and extremely dangerous at 44 mph, unless feathered in time. Remember, power is proportional to the cube of the wind speed. Old-fashioned Dutch windmills needed a two-man crew on 12-hour watch, seven days a week, because a runaway windmill first burnt its bearings, then its hardwood gears, then the entire superstructure.
This was the nightmare of millers everywhere in the “good” old days. And what did these beautiful antiques deliver? Fifteen horsepower at best, in favourable winds, about what a power lawn mower does these days. No wonder the Dutch switched to steam-powered pumping stations as soon as they could, in the late 19th century.
Since the power generated by modern wind turbines is so unpredictable, conventional power plants have to serve as back-ups. These run at less than half power most of the time. That is terribly uneconomical - only at full power do they have good thermal efficiency and minimal CO2 emissions per kWh delivered.
Think also a moment of the cable networks needed: not only a fine-maze distribution network at the consumer end, but also one at the generator end. And what about servicing? How do you get a repair crew to a lonely hillside? Especially when you decided to put the wind park at sea? Use helicopters - now that is green!
For that matter, would you care to imagine what happens to rotor blades in freezing rain? Or how the efficiency of laminar-flow rotor blades decreases as bugs and dust accumulate on their leading edges?
Or what did happen in Germany more than once? German legislation gives wind power absolute priority, so all other forms of generating electricity have to back off when the wind starts blowing. This creates dangerous, almost uncontrollable instabilities in the high-voltage network. At those moments, power plant operators all over Europe sweat blood, almost literally. The synchronization of the system is also a scary job: alternating currents at 100,000 volts or more cannot be out of phase more than one degree or so, else circuit breakers pop everywhere and a brownout all over Europe starts.
One application might be attractive, though. Suppose you fill a water basin in the hills nearby using wind power when it blows, and turn the water turbines on when emergency power is needed for one reason or another (a power plant failure, a cold winter night).
Wind power is a green mirage of the worst kind. It looks green to simple souls but it is a technical nightmare. Nowhere I have been, be it Holland, Denmark, Germany, France or California, have I seen wind parks where all turbines were operating properly. Typically, 20% stand idle, out of commission, broken down. Use Google Videos to find examples of wind turbine crashes, start meditating and reach your own conclusions.
Why don’t politicians listen to engineers? Why do engineers cave in to politically inspired financing? Merely to join the green daydreaming? I am an engineer; I want to be proud of my profession.
Henk Tennekes is an aeronautical engineer and the former research director of KNMI, the Dutch National Weather Service. This article was published today by The Pielke Research Group here.
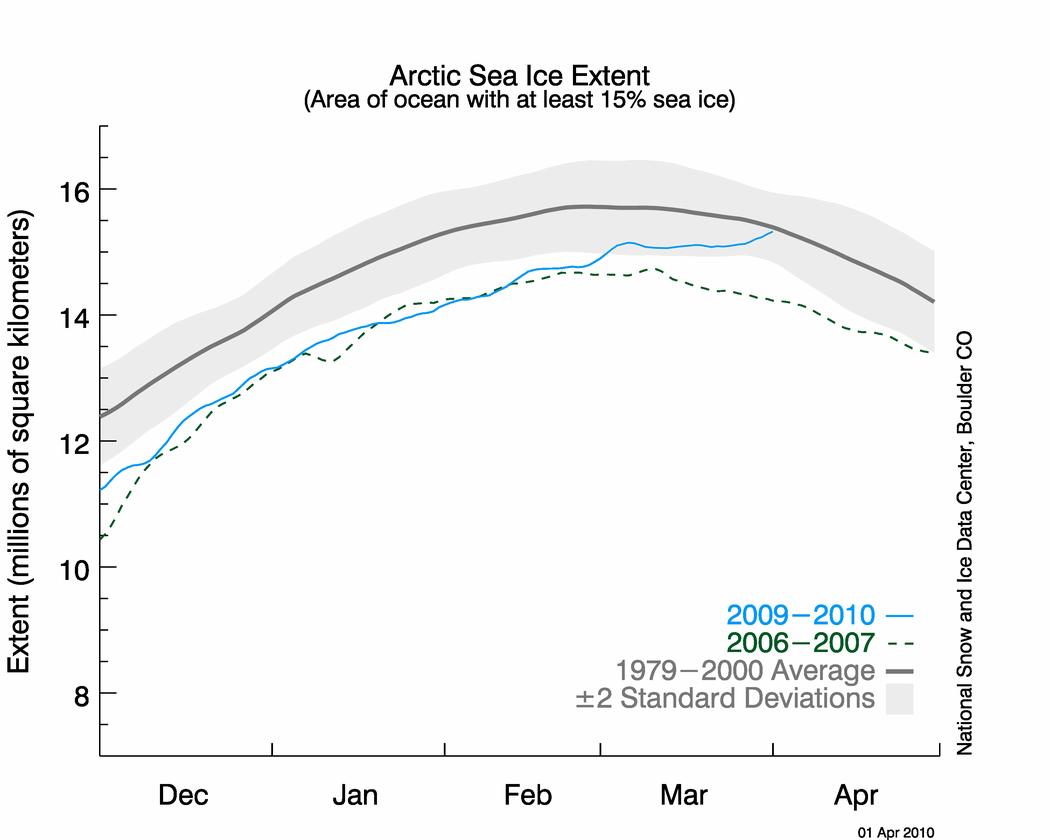
By Anthony Watts, Watts Up With That
The April 1st National Snow and Ice Data Center Arctic Sea Ice Extent plot continues its unusual upwards trend and is almost intersecting the “normal” line. Given the slope of the current trend it seems highly likely it will intersect the normal line with the April 2nd plot.
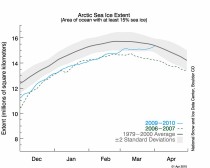
click here for a larger image
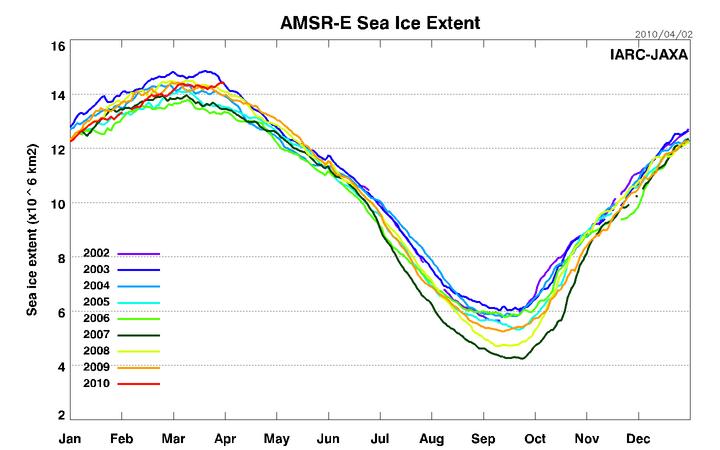
Other sea ice metrics such as JAXA, using a different satellite platform (AQUA) and the AMSR-E sensor agree.

click here for larger image
It is an odd sort of a divergence, this growth of Arctic Sea ice well past the normal start of “melt”.
As first mentioned in a WUWT story two days ago, Dr. Walt Meier of NSIDC says:
“It’s a good question about the last time we’ve been above average. It was May 2001.”
It may be winds pushing ice further southwards in the Bering Sea, it may be fresh ice. It may be a combination. While this event isn’t by itself an about-face of the longer downward trend we’ve seen, it does seem to suggest that predictions assuming a linear (or even spiral) demise aren’t holding up.
We live in interesting times. See post here.
By Blake Snow - FOXNews.com
NASA can put a man on the moon, but the space agency can’t tell you what the temperature was back then. Maps from NASA’s GISS reveal temperatures where no data exist, thanks to mathematical extrapolation of data. NASA was able to put a man on the moon, but the space agency can’t tell you what the temperature was when it did. By its own admission, NASA’s temperature records are in even worse shape than the besmirched Climate-gate data.
Maps from NASA’s GISS reveal temperatures where no data exist, thanks to mathematical extrapolation of data.
E-mail messages obtained by a Freedom of Information Act request reveal that NASA concluded that its own climate findings were inferior to those maintained by both the University of East Anglia’s Climatic Research Unit (CRU)—the scandalized source of the leaked Climate-gate e-mails—and the National Oceanic and Atmospheric Administration’s National Climatic Data Center.
The e-mails from 2007 reveal that when a USA Today reporter asked if NASA’s data “was more accurate” than other climate-change data sets, NASA’s Dr. Reto A. Ruedy replied with an unequivocal no. He said “the National Climatic Data Center’s procedure of only using the best stations is more accurate,” admitting that some of his own procedures led to less accurate readings.
“My recommendation to you is to continue using NCDC’s data for the U.S. means and [East Anglia] data for the global means,” Ruedy told the reporter.
“NASA’s temperature data is worse than the Climate-gate temperature data. According to NASA,” wrote Christopher Horner, a senior fellow at the Competitive Enterprise Institute who uncovered the e-mails. Horner is skeptical of NCDC’s data as well, stating plainly: “Three out of the four temperature data sets stink.”
Global warming critics call this a crucial blow to advocates’ arguments that minor flaws in the “Climate-gate” data are unimportant, since all the major data sets arrive at the same conclusion—that the Earth is getting warmer. But there’s a good reason for that, the skeptics say: They all use the same data.
“There is far too much overlap among the surface temperature data sets to assert with a straight face that they independently verify each other’s results,” says James M. Taylor, senior fellow of environment policy at The Heartland Institute.
“The different groups have cooperated in a very friendly way to try to understand different conclusions when they arise,” said Dr. James Hansen, head of NASA’s Goddard Institute for Space Studies, in the same 2007 e-mail thread. Earlier this month, in an updated analysis of the surface temperature data, GISS restated that the separate analyses by the different agencies “are not independent, as they must use much of the same input observations.”
Neither NASA nor NOAA responded to requests for comment. But Dr. Jeff Masters, director of meteorology at Weather Underground, still believes the validity of data from NASA, NOAA and East Anglia would be in jeopardy only if the comparative analysis didn’t match. “I see no reason to question the integrity of the raw data,” he says. “Since the three organizations are all using mostly the same raw data, collected by the official weather agency of each individual country, the only issue here is whether the corrections done to the raw data were done correctly by CRU.”
Corrections are needed, Masters says, “since there are only a few thousand surface temperature recording sites with records going back 100+ years.” As such, climate agencies estimate temperatures in various ways for areas where there aren’t any thermometers, to account for the overall incomplete global picture.
“It would be nice if we had more global stations to enable the groups to do independent estimates using completely different raw data, but we don’t have that luxury,” Masters adds. “All three groups came up with very similar global temperature trends using mostly the same raw data but independent corrections. This should give us confidence that the three groups are probably doing reasonable corrections, given that the three final data sets match pretty well.”
But NASA is somewhat less confident, having quietly decided to tweak its corrections to the climate data earlier this month.
In an updated analysis of the surface temperature data released on March 19, NASA adjusted the raw temperature station data to account for inaccurate readings caused by heat-absorbing paved surfaces and buildings in a slightly different way. NASA determines which stations are urban with nighttime satellite photos, looking for stations near light sources as seen from space.
Of course, this doesn’t solve problems with NASA’s data, as the newest paper admits: “Much higher resolution would be needed to check for local problems with the placement of thermometers relative to possible building obstructions,” a problem repeatedly underscored by meteorologist Anthony Watts on his SurfaceStations.org Web site. Last month, Watts told FoxNews.com that “90 percent of them don’t meet [the government’s] old, simple rule called the ‘100-foot rule’ for keeping thermometers 100 feet or more from biasing influence. Ninety percent of them failed that, and we’ve got documentation.”
Still, “confidence” is not the same as scientific law, something the public obviously recognizes. According to a December survey, only 25 percent of Americans believed there was agreement within the scientific community on climate change. And unless things fundamentally change, it could remain that way, said Taylor.
“Until surface temperature data sets are truly independent of one another and are entrusted to scientists whose objectivity is beyond question, the satellite temperature record alone will not have any credibility,” he said. Read more here. Read still more from NASA emails here.
Frank Warner, The Morning Call
Penn State global warming scientist Michael E. Mann regrets he did not instantly object when a fellow climatologist asked him in 2008 to delete e-mails subject to Freedom of Information requests.
“I wish in retrospect I had told him, ‘Hey, you shouldn’t even be thinking about this,’” Mann told The Morning Call in his first interview since the university last month launched an investigation into his conduct. “I didn’t think it was an appropriate request.”
Despite the request by his British colleague Phil Jones, Mann did not delete e-mails, a Penn State University panel of inquiry found on Feb. 3. But the panel ordered further investigation, still in progress, over a general allegation of scientific misconduct by Mann.
Penn State officials said Friday they could not yet provide further information on the probe. The investigation is a response to the uproar, commonly referred to as Climategate, over revelations of questionable comments made by climate scientists in e-mails made public in November. The furor has shaken the scientific community and fueled doubts about climate change. Mann, recognized internationally for his studies documenting global warming and the threat it poses, denies any wrongdoing and says he is cooperating fully with the Penn State investigation.
And in a wide-ranging interview, Mann says that not all global warming science is settled. It’s not yet certain, for example, that the heat is reducing the world population of polar bears or that it increases the number of hurricanes, he said. But he said there is almost no doubt the last half of the 20th century was the hottest 50-year period of the last millennium. That conclusion is reflected in Mann’s famous 1,000-year “hockey stick” chart of temperatures.
“There have been warming trends and cooling trends in the past,” Mann said. “Over the past 50 years, there has only been a warming trend. Contrarians cannot point to a sustained period—a 20- or 30-year period—of cooling over the past 50 years. If they could, you can be sure we would have heard about it.”
Mann has been controversial since 1998, when he and two colleagues published the “hockey stick” chart of the Northern Hemisphere’s temperatures from 1400 to 1998. The chart later was expanded to 1000 to 1999. It shows temperatures shooting up quickly in the 20th century—represented by the upward curving hockey stick “blade”—and reaching record highs late in the century.
Global warming skeptics have called Mann an alarmist, saying his studies have downplayed the heat of the Medieval Warm Period, around the year 1000, and overemphasized the heat of the last few decades. But in the interview with The Morning Call, Mann says at least a dozen studies have replicated his work and confirmed his conclusions. The more relevant question scientifically is whether our findings have been independently verified by independent teams using alternative methods and alternative data sources,” he said. “And the answer is definitively yes.”
Global warming might be happening just as Mann describes it, but he hasn’t made the case, said Stephen McIntyre, a Mann critic. McIntyre said Thursday that Mann’s 1,000 years of temperatures have yet to be proved accurate or valid. A mathematician in Toronto, McIntyre said Mann’s calculations rely too heavily on unreliable studies of the tree rings of ancient strip-bark trees. Mann said his studies combine several types of data, including data from tree rings, corals, ice cores and sediment. He also argued that some who challenge global warming are not real skeptics “because their skepticism is one-sided.”
“I would call them contrarians or, frankly in some cases, climate change deniers,” he said. “I’m a skeptic. When I see a scientific claim being made, I want to see it subject to scrutiny and validation.” Not every doomsday scenario is accurate either, he said, but scientists have reached a consensus that civilization faces serious problems if CO2 emissions are not reduced.
Read more of Mann here.
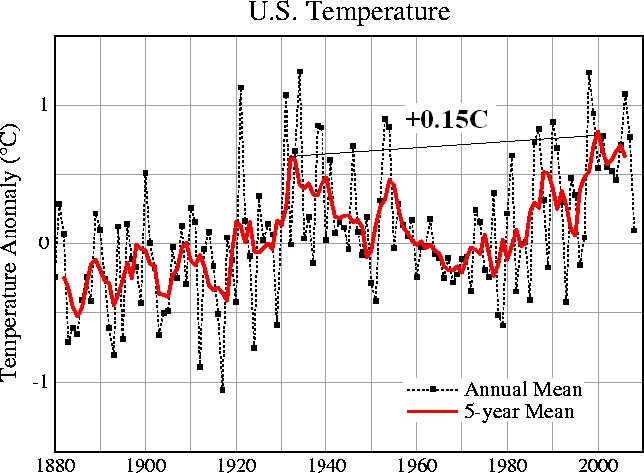
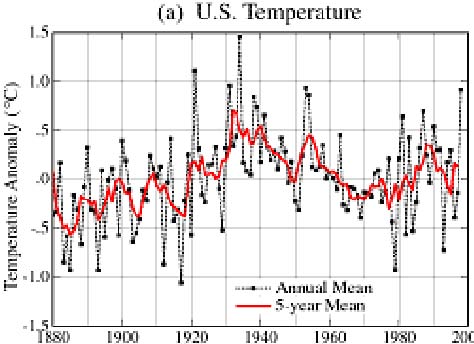
When first implemented in 1990 as Version 1, USHCN included an adjustment for urbanization (NCDC’s Tom Karl (1988)) well supported in the peer review literature. In 1999, NASA’s James Hansen published this graph of USHCN v.1 annual mean temperature (below, enlarged here):
About which NASA’s James Hansen correctly noted: “The US has warmed during the past century, but the warming hardly exceeds year-to-year variability. Indeed, in the US the warmest decade was the 1930s and the warmest year was 1934.” I show it because you can see a very distinct cooling from the 1930s to late 1970s. NCDC removed that UHI adjustment in version 2 in the last few years, bumping up the recent decade and down the earlier warm period, reducing the apparent cooling. A similar scenario was depicted in the global data until it gradually was made to go away by data adjustments as was shown here
Also Tom Wigley noted in one of the emails how they could make the pesky warm blip in the 1940s go away (and thus eliminate the even peskier cooling that followed) by adusting sea surface temperatures down then 0.15C, enough to make a difference and still be plausible.
As for the Medieval Warm Period, the 11 other studies Dr. Mann mentioned were all done by members of the same team using the same or similarly contaminated data and improper analyses. One, Keith Briffa, used “Mike’s trick” to “hide the decline” which meant to append UHI contaminated station data after 1960 on tree ring data that was used to rid the climate history of the MWP and Little Ice Ages because the tree ring data showed an inconvenient cooling after 1960. They were indeed able to replicate his same error but it does not prove he was right. Instead you should turn to the CO2 Science MWP project where to date they have collated peer review studies by 813 individual scientists from 485 separate research institutions in 43 different countries ... and counting that confirmed the Medieval Warm Period and the fact it was real and global in nature. Ironically one of the papers was a dissertation by a student of one of the authors of the original Mann etal paper that started it all.
By J. McLean, C.R. de Freitas, and R.M. Carter
Has the Journal of Geophysical Research been coerced into defending the climate alarmist faith?
Science is best progressed by open and free discussion in which all participants have equal rights of contribution. This is especially the case when a scientific issue is related to a matter of high public controversy - such as the hypothesis of dangerous human-caused global warming.
In July 2009 we published a paper in the peer-reviewed Journal of Geophysical Research (JGR) in which we described the results of comparing global atmospheric temperature since 1958 with variations in the El Nino-Southern Oscillation (ENSO) climatic framework. Our analysis supported earlier research that demonstrates a close link between these factors, and indicated that a large portion of the variability in global temperature is explained by ENSO variation, thus leaving little room for a substantial human influence on temperature.
On November 20, a newly appointed, replacement JGR editor informed us that a group of scientists led by Grant Foster (aka Tamino) had submitted a critique of our paper for publication in JGR. To which a reviewer responded “But as it is written, the current paper [Foster et al. draft critique] almost stoops to the level of “blog diatribe”. The current paper does not read like a peer-reviewed journal article. The tone is sometimes dramatic and sometimes accusatory. It is inconsistent with the language one normally encounters in the objectively-based, peer-reviewed literature.” Anonymous referee of the Foster et al. critique, September 28, 2009.
We were invited to write a response, which we did, submitting it to JGR on January 14, 2010.
On March 16, the replacement editor contacted us again. He included three referees’ reports, and indicated that on the advice of these referees he was rejecting our response to the Foster et al. critique, and that the response would therefore not be published in JGR.
The practice of editorial rejection of the authors’ response to criticism is unprecedented in our experience. It is surprising because it amounts to the editorial usurping of the right of authors to defend their paper and deprives readers from hearing all sides of a scientific discussion before they make up their own minds on an issue. It is declaring that the journal editor - or the reviewers to whom he defers - will decide if authors can defend papers that have already been positively reviewed and been published by that same journal. Such an attitude is the antithesis of productive scientific discussion.
Something smells, and a hint of what is on the wind is contained in the quotations at the head of this preamble.
To set the historical record straight, we relate below in date order the events - as they are known to us - that led to the editorial censorship of our reply to the critique by Foster et al.
Thereafter, we provide three appendices:
Appendix A - the Foster et al. critique of McLean et al., 2009, as posted on the web prior to its publication by AGU.
Appendix B - our (JGR-rejected) response to this critique.
Appendix C - a recent editorial commentary about AGU publishing practices by the President of the Union (which publishes JGR), Professor Timothy Grove.
The original research paper that is the subject of the critique (Appendix A) and the response (Appendix B) is: McLean, J., de Freitas, C.R. & Carter, R.M., (2009) Influence of the Southern Oscillation on tropospheric temperature. Journal of Geophysical Research 114, D14104, doi:10.1029/2008JD011637.
It can be accessed here.
How not to conduct a fair and impartial scientific debate:an itemised history of the AGU censorship
The following events occurred in relationship to a paper that we submitted for publication in the Journal of Geophysical Research on December 12, 2008, up until March 16, 2010, when the editor rejected our reply to criticism of our paper.
December 12, 2008. Initial submission of a paper by McLean, J., de Freitas, C.R. & Carter, R.M., titled “nfluence of the Southern Oscillation on tropospheric temperature”, for consideration for publication in the Journal of Geophysical Research (JGR), Atmospheres.
February 17, 2009. The first JGR editor that we dealt with forwards reports from three referees and a request that the authors revise the paper according to criticisms made by the referees.
One referee commented in part: “I found the paper to be well-organized, well-written, and clear on the importance of the research. The abstract is informative, reference section is excellent, and the graphics are of high quality. The findings are likely to be of interest to a wide variety of readers.”
A second referee commented in part: “This very clear and well-written manuscript is an analysis of the relationship between MSU-derived and radiosonde-based tropospheric temperature variability and the Southern Oscillation, as modified by major tropical volcanic eruptions. I find few faults with this analysis from a scientific standpoint; my primary concern is the lack of novelty. Climatologists have known about the strong linkage between the SOI (and its cousins) and tropospheric temperature for some time now. The authors acknowledge as much and they include most of the key references on the subject.”
As well as these general comments, all three referees made constructive criticisms of various technical points, to which we responded by modifying our manuscript to take account of them.
March 24, 2009. After incorporating appropriate modifications in response to the referees’ criticisms, a revised and improved manuscript is submitted to the AGU.
April 27, 2009. The editor indicates acceptance of the revised paper for publication in a forthcoming issue of JGR Atmospheres.
July 23, 2009. Publication of the McLean et al. paper in JGR Atmospheres.
The paper first established that a 7-month time-lagged relationship exists between changes in ENSO and changes in average global lower tropospheric temperature, except when volcanic eruptions cause cooling, and then applied this time lag to raw data in the Discussion and Conclusions. The establishment of the 7-month time lag employed an unusual method, but the period was in general agreement with earlier papers by other authors, and our Discussion and Conclusions would have been essentially the same if we had sourced the time lag from one of those other papers. The relevance of this point will become clear later.
Important note. We note that up to this point, all persons involved - namely, the JGR editor, referees and authors - had behaved according to the normal professional code of conduct that applies to papers being processed for scientific publication, and in accordance with the sentiments expressed on this matter in a statement by AGU president Professor Timothy Groves (see Appendix C). Thereby, a paper had been submitted, refereed, modified according to the referees’ comments, accepted by the editor, and finally published.
However, these circumstances were about to change and for the details we turn to emails that have been released into the public domain by the Climategate affair, and to our emailed exchanges with the JGR editor. Read about what happened next as alarmist like Grant Foster, James Annan, Phil Jones, Michael Mann, Jim Renwick, Jim Salinger, Gavin Schmidt and Kevin Trenberth and then the AGU itself showed their true colors here.
See also John McLean’s response to Lewandowsky’s shameless ad hominem rant in the ABC Drum (which was here) here.
By Joseph D’Aleo
The northeast had several harsh winters in the row with seasonal snow records the last two La Nina years in parts of northern and central New England. This year was a very different story especially in the lower elevations. It was a mild winter in the northeast even as areas in the Mid Atlantic to Florida and northwest to the Northern Plains were hit hard with cold (many areas coldest since the 1960s or 1970s) and in places even all time record snowfall. Why the topsy turvy weather? First let me say it was not unexpected and was the result of a combination of factors we will discuss in a moment. Here is a Boston Globe story of Record Early Ice Out on Lake Winnipesaukee near Mt. Washington, beating out the prior record set in 1921 by 4 days.
By Stefanie Geisler, Globe Staff
For 122 years, people have watched Lake Winnipesaukee to see when the ice clears and “Ice Out” can be declared, marking the coming of spring. This year, the day came so early it broke a record. Ice Out was declared Wednesday, beating the previous record, March 28, set in 1921, by four days.
David Emerson, the official ice watcher, made the declaration at 2 p.m. Wednesday. The announcement means the largest ship on the 70-square-mile lake can now safely make all ports of call, unimpeded by ice, he said. “It is a big deal,” Emerson said today of making the declaration. “But when it’s out, it’s out. You have to call it like you see it.”
Although there are still a few patches of ice on the lake, they are mostly in coves and will not block travel, Emerson said. That means the M/S Mount Washington cruise ship—which sails between the ports of Meredith, Center Harbor, Alton Bay, Wolfeboro, and Weirs Beach—can now traverse the lake.
Ice Out is a tradition dating back to 1888. The average Ice Out occurs in mid-April, Emerson said. But temperatures for January and February in the area have averaged three to five degrees warmer than normal, said. George Wiseman, a meteorologist with the National Weather Service in Grey, Maine. So far this month, the temperature in Concord has averaged 39.4 degrees, or about 7.4 degrees warmer than normal. And the high temperature has been above
freezing every day this month, according to weather service records. Emerson said the lake didn’t get a lot of snow this winter, and last week’s unusually warm temperatures - the temperature rose into the 60s and one day to 70—and buckets of rain deteriorated the ice. “Then we had the big winds there yesterday,” he said. “That finished it off.” See post here.
The winter as we reported early here was characterized by a moderately strong El Nino, and record (since 1950) negative arctic oscillation (below, enlarged here):
With the strong negative AO and North Atlantic Osicllation (NAO), the high pressure in Canada drew in maritime air into the northeast and southeast Canada where normally there is a pool of cold air that storms on the southern El Nino storm track can draw on to produce major snows for inland ande sometimes even coastal areas. The maritime air was cold enough to allow snow to fall in the higher elevations (it was a decent ski season) each time the coastal storms romped up the coast but it was a cold rain down in lower elevations to the coast.
March 1977 was quite mild, in fact compositing the top 3 most negative AO winter Marchs we see (below, enlarged here):
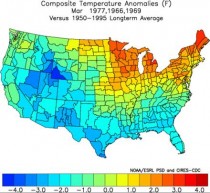
This March has looked like those years thus far (though some arctic air invaded briefly today in the northeast). Notice also that it has remained cold in the southeast (below, enlarged here):
It has been very wet in the east with several nor’easters that had there been cold arctic air in place instead of maritime Atlantic air would have buried the region in snow. Instead heavy flooding rains have resulted in the wettest March beating out 1953 in Boston and 1983 in New York City. It was the wettest month ever in Providence, RI (see story here).
And thanks to Craig from Weather Source (an excellent source of weather data), Minneapolis may end March without snow for the first time since the 1800s. “It looks like we’ll finish out the month without snow,” says FOX 9 meteorologist Erik Maitland. “This will be the third time that we’ve done that. But you have to go way back to 1860, 1878 for snowless Marches.” See more here and here.
By Will Stewart
In a new blow to the climate change lobby, Russia’s top weatherman today announced that the winter now drawing to a close in Siberia may turn out to be the coldest on record. ‘The winter of 2009-10 was one of the most severe in European part of Russia for more than 30 years, and in Siberia it was perhaps the record breaking coldest ever,’ said Dr Alexander Frolov, head of state meteorological service Rosgidromet.
Statistics are still being analysed in detail, but it is known that in western Siberia the mean temperature was minus 23.2C, with more colder days than in previous years. Russia’s top weatherman today announced that the winter now drawing to a close in Siberia may turn out to be the coldest on record. Some 63 days were colder than minus 25C and 39 days below minus 30C.
For this part of Siberia, this represents the coldest conditions in 40 years and the second harshest winter in 110 years. Equivalent statistics for colder eastern Siberia have not been issued yet. The coldest recorded temperature in the recent winter is believed to have been minus 57.4C degrees in Oymyakon on 20 January.
The remote town in eastern Siberia is the coldest inhabited community in the world. ‘When we say that this winter in Siberia was record breaking, we are aware that temperatures on some days of other years may have gone lower, but in the most recent winter the substantial cold was staying longer than usual and over larger regions than usual,’ said Dmitry Kiktev, deputy head of Rosgidromet.
‘There were periods of so-called “monotonous cold” when the weather was less diverse, and the cold remained strong and stable to record levels.’ Mr. Frolov also offered bad news for Russians hoping for a speedy respite from the long winter. ‘We can officially say that beginning of the spring in Russia is postponed for another seven to 10 days,’ he warned.
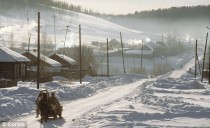
Beryozovka, Russia: The beginning of the spring in Russia has been postponed for another seven to 10 days, according to a Russian weatherman. The Urals and Siberia would continue to face ‘winter-like temperatures’ well into April, while European Russia would be below average, he said. Climate change adherents say the planet is warming due to man-made factors but Russian expert Professor Arkady Tishkov said yesterday that Siberia and the world are in fact getting colder.
‘From a scientific point of view, talk about increasing average temperatures on earth of several degrees are absurd,’ he said. Of course we can’t say that global warming is a myth and falsification. In many regions of planet the temperature is higher than expected because of human impact. ‘But the climate system of the planet is changing according to different cycles - from several years to thousand of years.
‘From the scientific point of view, in terms of large scale climate cycles, we are in a period of cooling. ‘The last three years of low temperatures in Siberia, the Arctic and number of Russia mountainous regions prove that, as does the recovery of ice in the Arctic Ocean and the absence of warming signs in Siberia.’
Mr Tishkov, deputy head of the Geography Institute at Russian Academy of Science, said: ‘What we have been watching recently is comparatively fast changes of climate to warming, but within the framework of an overall long-term period of cooling. This is a proven scientific fact. ‘The recent warming - and we are talking tenths of a degree at most - is caused by human activity, like forest elimination, the changing of landscapes.
‘The greenhouse gases so much discussed now do not in fact play big role. We have to remember that all the impact of industrial enterprises in Russia cannot be compared with one volcano eruption on our planet.’ On the latest Siberian statistics, Mr Kiktev said: ‘This winter does not prove that global warming is a myth, just as recent warm winters do not prove it does exist.
‘These are just small peaks in the climate process. What they show, if anything, we will be able to judge in tens of years from now.’ Read more here.
-------------------------
Killer icicles terrorise Russians
By Marina Koreneva Marina Koreneva - Wed Mar 24
SAINT PETERSBURG (AFP) - Walking along a Saint Petersburg Street immersed in music, Milana Kashtanova, became the latest victim of falling icicles and ice blocks that have killed five people and injured 147 in the city following Russia’s coldest winter in 30 years. Kashtanova, 21, has been in a coma since February when she was hit by the ice which was being cleared from a rooftop.
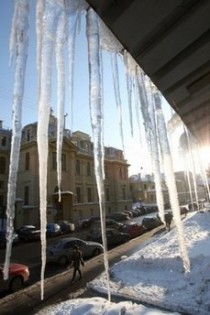
“Milana was just walking past a building in the city centre… There was no warning tape, nothing to alert people that people were working on the roof,” Kashtanova’s boyfriend, Irinei Kalachev, told AFP. The toll has prompted residents and relatives of victims to demand action against those responsible for what they believe to be careless clearing of ice from rooftops. “Every day, I go out into the street as if I was entering a war zone,” complained resident Boris Ilinsky, 28. “I’ve got to keep my eyes on the ground to avoid slipping and I’m also looking up to avoid falling lumps of ice,” he added.
In Kashtanova’s case, municipal authorities argued that the accident was her own fault, saying she ignored warning shouts from street cleaners because she was wearing headphones and listening to music, Kalachev said. But her outraged family has appealed to Russian President Dmitry Medvedev, demanding that he punish the city officials responsible. The city hall however says that accidents are inevitable given the scale of the ice-clearing after such a severe winter.
“The snow falls this winter have been unprecedented, a kind of natural disaster. Unfortunately, there are victims,” Yury Osipov, head of Saint Petersburg’s housing committee, told AFP. “There are 13,500 roofs in Saint Petersburg. With the current record snowfalls, the roofs should be cleared weekly to prevent blocks of ice. That’s impossible, not least because it would paralyse traffic in the city.”
The tragedy of Milana Kashtanova’s accident is not uncommon. Thousands of street cleaners take to the rooftops of Russia’s cities during the spring thaw, sweeping masses of snow and sharp-edged blocks of ice onto the pavements. That means that during Russia’s springtime thaw, residents are forced to run the gauntlet of snapping icicles and blocks of ice falling unexpectedly from roofs, as well as the ground-level hazards of slippery slush and puddles.
This week alone, a 55-year-old woman in central Moscow and a pensioner in the southwestern city of Voronezh were also killed by falling icicles, local investigators said. Residents in Saint Petersburg complain that local authorities do not take proper precautions to protect the public. “I have seen city employees clearing roofs without putting in place any safeguards to protect passersby,” said city resident Marina Romanova.
In the face of mounting criticism, however, Saint Petersburg governor Valentina Matviyenko, has yielded to the pressure and threatened to fire dozens of city officials. Read story here.
By Marina Koreneva Marina Koreneva - Wed Mar 24
SAINT PETERSBURG (AFP) - Walking along a Saint Petersburg Street immersed in music, Milana Kashtanova, became the latest victim of falling icicles and ice blocks that have killed five people and injured 147 in the city following Russia’s coldest winter in 30 years. Kashtanova, 21, has been in a coma since February when she was hit by the ice which was being cleared from a rooftop.
“Milana was just walking past a building in the city centre… There was no warning tape, nothing to alert people that people were working on the roof,” Kashtanova’s boyfriend, Irinei Kalachev, told AFP.
The toll has prompted residents and relatives of victims to demand action against those responsible for what they believe to be careless clearing of ice from rooftops.
“Every day, I go out into the street as if I was entering a war zone,” complained resident Boris Ilinsky, 28.
“I’ve got to keep my eyes on the ground to avoid slipping and I’m also looking up to avoid falling lumps of ice,” he added.
In Kashtanova’s case, municipal authorities argued that the accident was her own fault, saying she ignored warning shouts from street cleaners because she was wearing headphones and listening to music, Kalachev said.
But her outraged family has appealed to Russian President Dmitry Medvedev, demanding that he punish the city officials responsible. The city hall however says that accidents are inevitable given the scale of the ice-clearing after such a severe winter.
“The snow falls this winter have been unprecedented, a kind of natural disaster. Unfortunately, there are victims,” Yury Osipov, head of Saint Petersburg’s housing committee, told AFP.
“There are 13,500 roofs in Saint Petersburg. With the current record snowfalls, the roofs should be cleared weekly to prevent blocks of ice. That’s impossible, not least because it would paralyse traffic in the city.”
The tragedy of Milana Kashtanova’s accident is not uncommon. Thousands of street cleaners take to the rooftops of Russia’s cities during the spring thaw, sweeping masses of snow and sharp-edged blocks of ice onto the pavements.
That means that during Russia’s springtime thaw, residents are forced to run the gauntlet of snapping icicles and blocks of ice falling unexpectedly from roofs, as well as the ground-level hazards of slippery slush and puddles.
This week alone, a 55-year-old woman in central Moscow and a pensioner in the southwestern city of Voronezh were also killed by falling icicles, local investigators said.
Residents in Saint Petersburg complain that local authorities do not take proper precautions to protect the public. “I have seen city employees clearing roofs without putting in place any safeguards to protect passersby,” said city resident Marina Romanova.
In the face of mounting criticism, however, Saint Petersburg governor Valentina Matviyenko, has yielded to the pressure and threatened to fire dozens of city officials. Read story here.
An unusually late season snow hit the southern plains the last several days. After heavy snows fell in Wyoming and Colorado, heavy snow (8-12 inches) bands redeveloped in southeast Kansas, southwest Missouri and eastern Oklahoma (see map here).
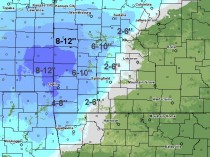
Lighter amounts fell in north Texas but it places like Dallas the most so late in the season. Recall earlier in the winter, the earliest measurable snow on record fell in Houston and in February 12.5 inches fell in Dallas.
PUBLIC INFORMATION STATEMENT
NATIONAL WEATHER SERVICE FORT WORTH TX
1137 AM CDT SUN MAR 21 2010
...SPRING SNOW FOR DFW…
Dallas Fort Worth DFW airport recorded 1.2 inches of snow on March 20th. This breaks the previous daily record for March 20th of 0.4 inches set in 1970. An additional 0.1 of an inch officially fell on March 21st and the event total is 1.3 inches. The additional 1.3 inches brings the 2009-2010 winter total to 17.1 inches. This ranks second of all time and came 0.5 inches shy of tying the all-time record of 17.6 inches set in 1977 -1978.
This snow event was unseasonably late in the year. The last time an inch or more fell at DFW later than March 20th was when 2 inches fell on March 29th in 1937.
-------------------------
DALLAS/FORT WORTH - SNOWIEST SEASONS
1 17.6 1977-78
2 17.1 2009-10*
3 15.3 1963-64
4 13.5 1923-24
5 10.4 1976-77
6 9.5 1909-10
7 9.2 1916-17
8 8.8 1947-48
9 8.1 1937-38
10 7.3 1965-66
10 7.3 1941-42
See PDF.
------------------------
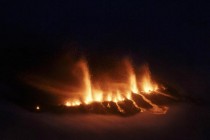
Volcano erupts in Iceland, hundreds evacuated
By Gudjonb Helgason and Paisley Dodds, AP
REYKJAVIK, Iceland - A volcano erupted near a glacier in southern Iceland, shooting ash and molten lava into the air and forcing the evacuation Sunday of hundreds of people from a nearby village.

There were no immediate reports of injuries or damage from the volcano but a state of emergency was declared in communities near the Eyjafjallajokull glacier and scientists feared the eruption could trigger a larger and potentially more dangerous eruption at the nearby Katla volcano.
Saturday’s eruption, which occurred just before midnight (2000 EDT, 8 p.m.), came weeks after a series of small earthquakes. Television footage showed lava flows along the fissure.
“This was a rather small and peaceful eruption but we are concerned that it could trigger an eruption at the nearby Katla volcano, a vicious volcano that could cause both local and global damage,” said Pall Einarsson, a geophysicist at the University of Iceland’s Institute of Earth Science.
Icecap Note: The eruption was mainly a low level event - mainly lava and ash below 5000 feet. Gases emitted may be reaching higher. The threat is what COULD come next. The volcano Katla is subglacial and has a reputation as one of the most dangerous volcanoes of Iceland. Its peak reaches 1493 m in height and the extension of the glacier Myrdalsjokull which lies over it reaches 595 sq km. The crater of the volcano has a diameter of 10 km and the volcano normally erupts every 40 - 80 years. The last eruption took place in 1918, meaning scientists monitor the volcano very carefully. Since 930, 16 eruptions have been documented. The Laki craters and the Eldgja are part of the same volcanic system, so it can be regarded as one of the most powerful in the world.
Authorities evacuated 450 people in the area 160 kilometers (100 miles) southeast of the capital, Reykjavik, said Vidir Reynisson of the Icelandic Civil Protection Department. Evacuation centers were set up near the village of Hella.
The most immediate threat was to livestock because of the caustic gases.
“We had to leave all our animals behind,” Elin Ragnarsdottir, a 47-year-old farmer, told RUV, Iceland’s national broadcaster from one of the evacuation centers. “We got a call and a text message ... and we just went.”
Iceland sits on a large volcanic hot spot in the mid-oceanic ridge. Volcanic eruptions are often triggered by seismic activity when the Earth’s plates move and when magma from deep underground pushes its way to the surface.
Scientists have been monitoring recent activity using seismometers and global positioning instruments,
“This event has had a long prelude in earthquake activity,” Einarsson told The Associated Press. “The volcano has been inflating since the beginning of the year, both rising and swelling. One of the possible scenarios we’re looking at is that this small eruption could bring about something bigger.”
Authorities initially feared the eruption occurred below the 100-square-mile (160 square-kilometer) glacier and could have triggered floods if the glacial ice melted. Scientists, however, concluded from an aerial survey Sunday that the eruption occurred near the glacier in an area where there was no ice.
“This is the best possible place for an eruption,” said Tumi Gudumundsson, a geologist at the University of Iceland.
There hasn’t been an eruption near the Eyjafjallajokull glacier since 1821.
The Icelandic Civil Aviation Administration ordered aircraft to stay 120 nautical miles away from the volcano area, essentially closing it off because visibility is low in some areas. Reykjavik appeared to be unaffected with clear visibility.
All domestic flights were canceled until further notice, the Icelandic National Broadcasting Service reported.
Three Icelandair flights from the U.S. - departing from Seattle, Boston and Orlando, Florida - bound for Keflavik airport in Reykjavik were turned back to Boston, leaving about 500 people waiting, the airline said.
Flights to Stockholm, London, Amsterdam and Frankfurt were scheduled to leave Sunday morning but a flight to Oslo was canceled and passengers were being rerouted. The airline expected further delays throughout Sunday.
First settled by Vikings in the 9th century, Iceland is known as the land of fire and ice because of its volcanos and glaciers.
In the mid 1780s, the Laki volcano erupted, prompting scores to die of famine when livestock and crops were destroyed. During the Middle Ages, Icelanders called the Hekla volcano the “Gateway to Hell,” believing that souls were dragged below. Hekla is Iceland’s most active volcano.
See report on how high latitude volcanoes affect climate with a look at Alaska, Iceland and Kamchatka here.
Walter E. Williams, Washington Times, Wednesday, March 17, 2010
Stephen Dinan’s Washington Times article “Climate Scientist to Fight Back at Skeptics,” (March 5, 2010) tells of a forthcoming campaign that one global warmer said needs to be “an outlandishly aggressively partisan approach” to gut the credibility of skeptics. “Climate scientists at the National Academy of Sciences say they are tired of ‘being treated like political pawns’ and need to fight back...” Part of their strategy is to form a nonprofit organization and use donations to run newspaper ads to criticize critics. Stanford professor and environmentalist Paul Ehrlich, in one of the e-mails obtained by the Washington Times said, “Most of our colleagues don’t seem to grasp that we’re not in a gentlepersons’ debate, we’re in a street fight against well-funded, merciless enemies who play by entirely different rules.”
Professor Thomas Sowell’s most recent book, “Intellectuals and Society,” has a quote from Eric Hoffer, “One of the surprising privileges of intellectuals is that they are free to be scandalously asinine without harming their reputation.” Environmentalist Professor Paul Ehrlich, who’s giving advice to the warmers, is an excellent example of Hoffer’s observation. Ehrlich in his widely read 1968 book, “The Population Bomb,” predicted, “The battle to feed humanity is over. In the 1970s, the world will undergo famines. Hundreds of millions of people are going to starve to death in spite of any crash programs embarked upon now. Population control is the only answer.” Ehrlich also predicted the earth’s then-5 billion population would starve back to 2 billion people by 2025. In 1969, Dr. Ehrlich warned Britain’s Institute of Biology, “If I were a gambler, I would take even money that England will not exist in the year 2000.” Despite these asinine predictions, Ehrlich has won no less than 16 awards, including the 1980 Crafoord Prize, the Royal Swedish Academy of Sciences’ highest award.
Stanford University professor and environmentalist activist Stephen H. Schneider is another scientist involved in the warmer retaliation. In a 1989 Discover Magazine interview, Professor Schneider said, “We have to offer up scary scenarios, make simplified dramatic statements, and make little mention of any doubts we may have. Each of us has to decide what the right balance is between being effective and being honest.”
Former Colorado Sen. Tim Wirth, now president of the United Nations Foundation, in 1990 said, “We’ve got to ride the global warming issue. Even if the theory of global warming is wrong, we’ll be doing the right thing, in terms of economic policy and environmental policy.”
Environmental activist predictions have been dead wrong. In National Wildlife (July 1975), Nigel Calder warned, “… the threat of a new ice age must now stand alongside nuclear war as a likely source of wholesale death and misery for mankind.” In the same issue, C.C. Wallen of the World Meteorological Organization warned, “The cooling since 1940 has been large enough and consistent enough that it will not soon be reversed.”
George Woodwell’s, founder of the Woods Hole Research Center, comments suggest that the warmers are gearing up for a big propaganda push. In one of his e-mails, Woodwell said that researchers have been ceding too much ground. He criticized Pennsylvania State University for their academic investigation of Professor Michael Mann, who wrote many of the e-mails leaked from the Britain’s now disgraced Climate Research Unit. Stephen Dinan’s Washington Times article reports, “In his e-mail, Mr. Woodwell acknowledged that he is advocating taking ‘an outlandishly aggressively partisan approach’ but said scientists have had their ‘classical reasonableness’ turned against them,” adding, “‘We are dealing with an opposition that is not going to yield to facts or appeals from people who hold themselves in high regard and think their assertions and data are obvious truths.’”
Fortunately, for the American people, Sen. James M. Inhofe, R- Okla., is considering asking the Justice Department to investigate whether climate scientists who receive taxpayer-funded grants have falsified data. He has identified 17 taxpayer-supported scientists who have been major players in the global warming conspiracy.
Here is an opinion piece by Judith Curry in Physics Today “Can scientists rebuild the public trust in climate science?.”
By Dr. Roy Spencer
INTRODUCTION
My last few posts have described a new method for quantifying the average Urban Heat Island (UHI) warming effect as a function of population density, using thousands of pairs of temperature measuring stations within 150 km of each other. The results supported previous work which had shown that UHI warming increases logarithmically with population, with the greatest rate of warming occurring at the lowest population densities as population density increases.

Nightlights enlarged here.
But how does this help us determine whether global warming trends have been spuriously inflated by such effects remaining in the leading surface temperature datasets, like those produced by Phil Jones (CRU) and Jim Hansen (NASA/GISS)?
While my quantifying the UHI effect is an interesting exercise, the existence of such an effect spatially (with distance between stations) does not necessarily prove that there has been a spurious warming in the thermometer measurements at those stations over time. The reason why it doesn’t is that, to the extent that the population density of each thermometer site does not change over time, then various levels of UHI contamination at different thermometer sites would probably have little influence on long-term temperature trends. Urbanized locations would indeed be warmer on average, but “global warming” would affect them in about the same way as the more rural locations.
This hypothetical situation seems unlikely, though, since population does indeed increase over time. If we had sufficient truly-rural stations to rely on, we could just throw all the other UHI-contaminated data away. Unfortunately, there are very few long-term records from thermometers that have not experienced some sort of change in their exposure...usually the addition of manmade structures and surfaces that lead to spurious warming.
Thus, we are forced to use data from sites with at least some level of UHI contamination. So the question becomes, how does one adjust for such effects?
As the provider of the officially-blessed GHCN temperature dataset that both Hansen and Jones depend upon, NOAA has chosen a rather painstaking approach where the long-term temperature records from individual thermometer sites have undergone homogeneity “corrections” to their data, mainly based upon (presumably spurious) abrupt temperature changes over time. The coming and going of some stations over the years further complicates the construction of temperature records back 100 years or more.
All of these problems (among others) have led to a hodgepodge of complex adjustments.
A SIMPLER TECHNIQUE TO LOOK FOR SPURIOUS WARMING
I like simplicity of analysis - whenever possible, anyway. Complexity in data analysis should only be added when it is required to elucidate something that is not obvious from a simpler analysis. And it turns out that a simple analysis of publicly available raw (not adjusted) temperature data from NOAA/NESDIS NOAA/NCDC, combined with high-resolution population density data for those temperature monitoring sites, shows clear evidence of UHI warming contaminating the GHCN data for the United States.
I will restrict the analysis to 1973 and later since (1) this is the primary period of warming allegedly due to anthropogenic greenhouse gas emissions; (2) the period having the largest number of monitoring sites has been since 1973; and (3) a relatively short 37-year record maximizes the number of continuously operating stations, avoiding the need to handle transitions as older stations stop operating and newer ones are added.
Similar to my previous posts, for each U.S. station I average together four temperature measurements per day (00, 06, 12, and 18 UTC) to get a daily average temperature (GHCN uses daily max/min data). There must be at least 20 days of such data for a monthly average to be computed. I then include only those stations having at least 90% complete monthly data from 1973 through 2009. Annual cycles in temperature and anomalies are computed from each station separately.
I then compute multi-station average anomalies in 5×5 deg. latitude/longitude boxes, and then compare the temperature trends for the represented regions to those in the CRUTem3 (Phil Jones) dataset for the same regions. But to determine whether the CRUTem3 dataset has any spurious trends, I further divide my averages into 4 population density classes: 0 to 25; 25 to 100; 100 to 400; and greater than 400 persons per sq. km. The population density data is at a nominal 1 km resolution, available for 1990 and 2000 I use the 2000 data.
All of these restrictions then result in thirteen 24 to 26 5-deg grid boxes over the U.S. having all population classes represented over the 37-year period of record. In comparison, the entire U.S. covers about 40 grid boxes in the CRUTem3 dataset. While the following results are therefore for a regional subset (at least 60%) of the U.S., we will see that the CRUTem3 temperature variations for the entire U.S. do not change substantially when all 31 40 grids are included in the CRUTem3 averaging.
EVIDENCE OF A LARGE SPURIOUS WARMING TREND IN THE U.S. GHCN DATA
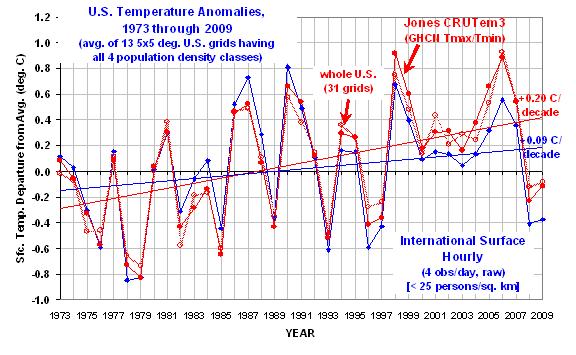
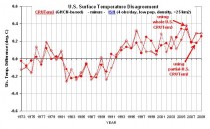
The following chart shows yearly area-averaged temperature anomalies from 1973 through 2009 for the 24 to 26 5-deg. grid squares over the U.S. having all four population classes represented (as well as a CRUTem3 average temperature measurement). All anomalies have been recomputed relative to the 30-year period, 1973-2002. (below, enlarged here.
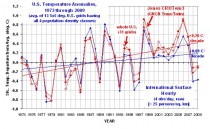
The heavy red line is from the CRUTem3 dataset, and so might be considered one of the “official” estimates. The heavy blue curve is the lowest population class. (The other 3 population classes clutter the figure too much to show, but we will soon see those results in a more useful form.)
Significantly, the warming trend in the lowest population class is only 47% of the CRUTem3 trend, a factor of two difference.
Also interesting is that in the CRUTem3 data, 1998 and 2006 would be the two warmest years during this period of record. But in the lowest population class data, the two warmest years are 1987 and 1990. When the CRUTem3 data for the whole U.S. are analyzed (the lighter red line) the two warmest years are swapped, 2006 is 1st and then 1998 2nd.
From looking at the warmest years in the CRUTem3 data, one gets the impression that each new high-temperature year supersedes the previous one in intensity. But the low-population stations show just the opposite: the intensity of the warmest years is actually decreasing over time.
To get a better idea of how the calculated warming trend depends upon population density for all 4 classes, the following graph shows - just like the spatial UHI effect on temperatures I have previously reported on - that the warming trend goes down nonlinearly as population density of the stations decrease. In fact, extrapolation of these results to zero population density might produce little warming at all! (below, enlarged here. )
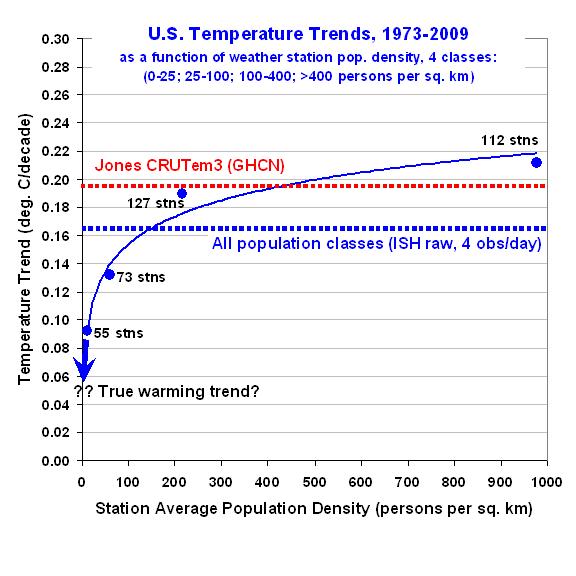
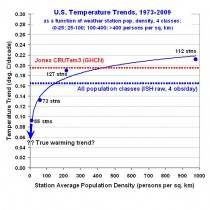
This is a very significant result. It suggests the possibility that there has been essentially no warming in the U.S. since the 1970s.
Also, note that the highest population class actually exhibits slightly more warming than that seen in the CRUTem3 dataset. This provides additional confidence that the effects demonstrated here are real.
Finally, the next graph shows the difference between the lowest population density class results seen in the first graph above. This provides a better idea of which years contribute to the large difference in warming trends. (below, enlarged here. )
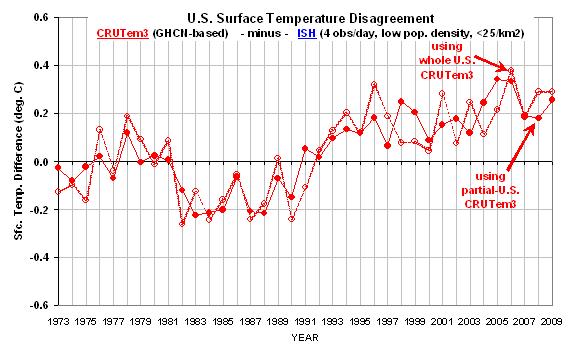
Taken together, I believe these results provide powerful and direct evidence that the GHCN data still has a substantial spurious warming component, at least for the period (since 1973) and region (U.S.) addressed here.
There is a clear need for new, independent analyses of the global temperature data the raw data, that is. As I have mentioned before, we need independent groups doing new and independent global temperature analyses - not international committees of Nobel laureates passing down opinions on tablets of stone.
But, as always, the analysis presented above is meant more for stimulating thought and discussion, and does not equal a peer-reviewed paper. Caveat emptor. See full post and more here.